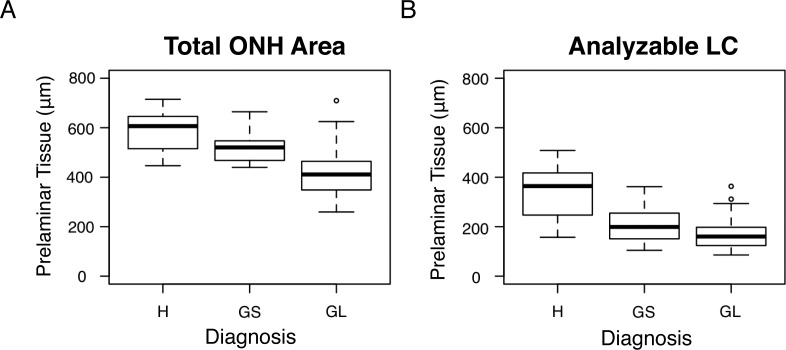
Figure 6.
The average prelaminar tissue thickness of each diagnostic group for (A) the entire ONH region and (B) the regions that featured analyzable en face LC. A significant difference in total average prelaminar thickness (A) was seen between glaucaoma (GL) and healthy (H) eyes and glaucoma and glaucoma suspect (GS) eyes (both P < 0.001). The average prelaminar tissue thickness in regions where the LC was analyzable was significantly thinner in glaucoma eyes than glaucoma suspect and healthy eyes (P = 0.008 and P < 0.001, respectively), and glaucoma suspect eyes had significantly thinner prelaminar tissue than healthy eyes (P < 0.001).

