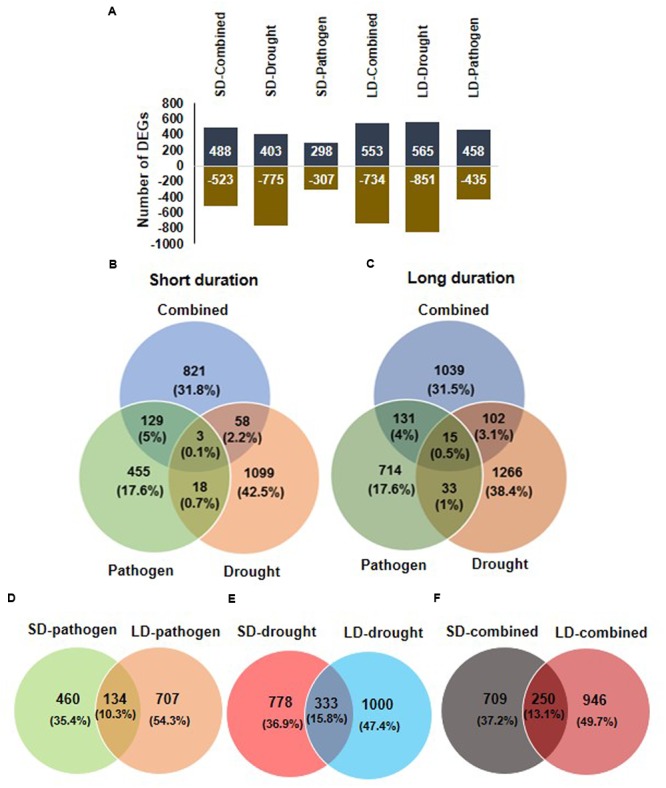
FIGURE 1.

Overview of differentially expressed genes (DEGs) in chickpea transcriptome in response to combined and individual stresses. To study the transcriptomic changes in chickpea ICC4958 in response to pathogen (Ralstonia solanacearum), drought and combination of R. solanacearum and drought stress, chickpea plants were imposed with drought alone, pathogen alone and combined stress for short duration (SD; 2 days) and long duration (LD; 4 days) and named as SD-stresses and LD-stresses, respectively. DEGs over control in drought only treated plant and over mock in pathogen treated and combined stresses plants were obtained by microarray analysis. Total number of DEGs having a minimum fold change of 1 (Log2 transformed) and p < 0.05 under all six stress treatments, SD stresses (SD-pathogen, SD-drought, SD-combined) and LD stresses (LD-pathogen, LD-drought, LD-combined) are represented in graph (A). Positive values in chart shows number of up-regulated and negative values represents number of down-regulated DEGs. The number of common and unique genes among different SD stresses and LD stresses are shown in Venn diagram (B,C), respectively. Number of DEGs unique and common in SD- and LD-pathogen (D), SD- and LD-drought (E) and SD- and LD-combined stress (F) are shown.
