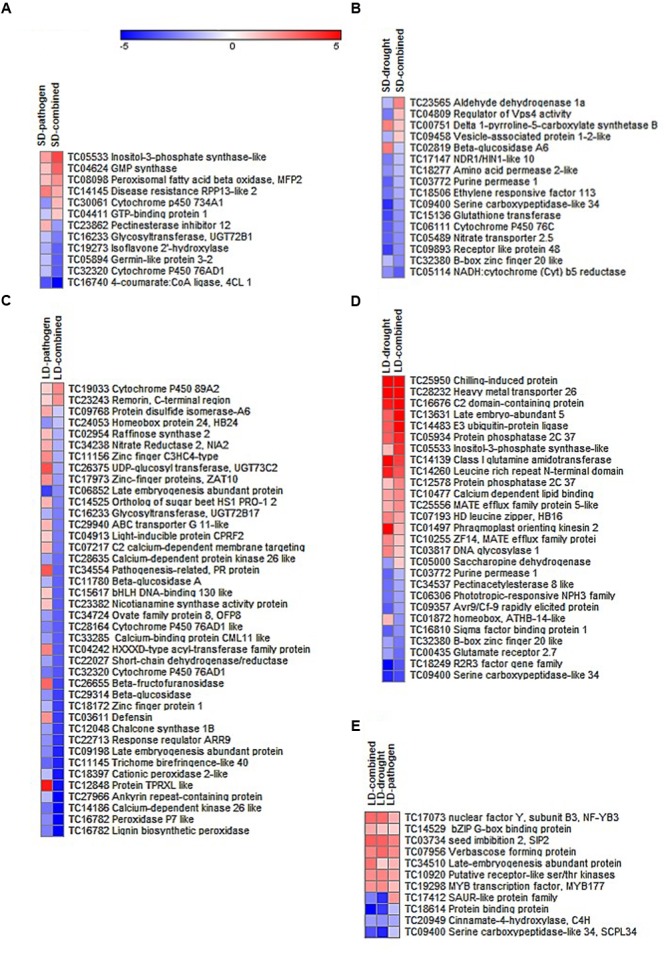
FIGURE 2.

Expression profile of DEGs common between combined and individual stresses. The DEGs with more than one fold expression and p < 0.05 under SD treatments (SD-pathogen, SD-drought, SD-combined stress) and LD treatments (LD-pathogen, LD-drought, LD-combined) were compared and DEGs common between combined and individual stresses were selected. The heat maps represent DEGs which are shared between combined and individual stresses but have at least one fold difference in their expression between two treatments. Heat map (A) represents 12 shared genes with differential expression out of total 129 common genes between SD-pathogen and SD-combined and (B) represents 16 out of total 58 shared genes between SD-drought and SD-combined stress with different expression. Similarly, heat map (C) represents 40 genes with differential expression out of total 131 common genes between LD-pathogen and LD-combined and (D) represents 27 out of total 102 common genes between LD-drought and LD-combined stress. Expression level of DEGs common among all LD stresses are represented in heat map (E). Color scale shows gene expression range where color bar in red and blue represents up- and down-regulated genes, respectively. Details of the genes shown in heat maps are available in Supplementary File S5.
