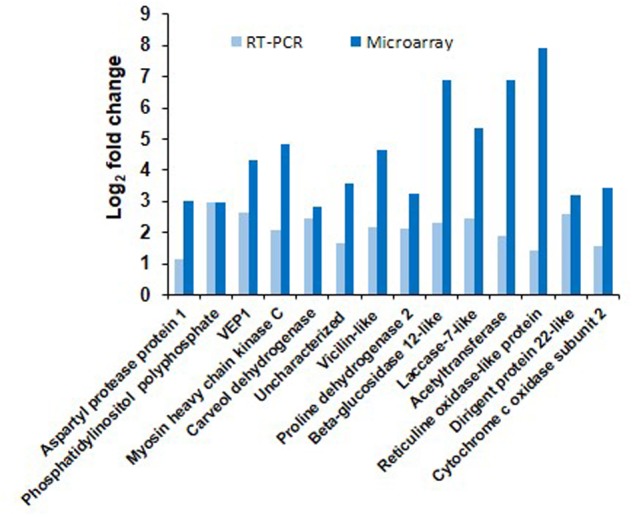
FIGURE 3.

Validation of microarray results by RT-qPCR. Transcript expression pattern of selected genes from microarray data was validated by RT-qPCR. Bar chart represents fold change expression (Log2 FC) of the genes by RT-qPCR (light blue) and microarray (dark blue) under SD-combined stress. CaActin was used as reference gene for the qPCR normalization. Fold change was calculated over mock control. Each bar represents average of two biological and two technical replicates. Results presented are from one experiment.
