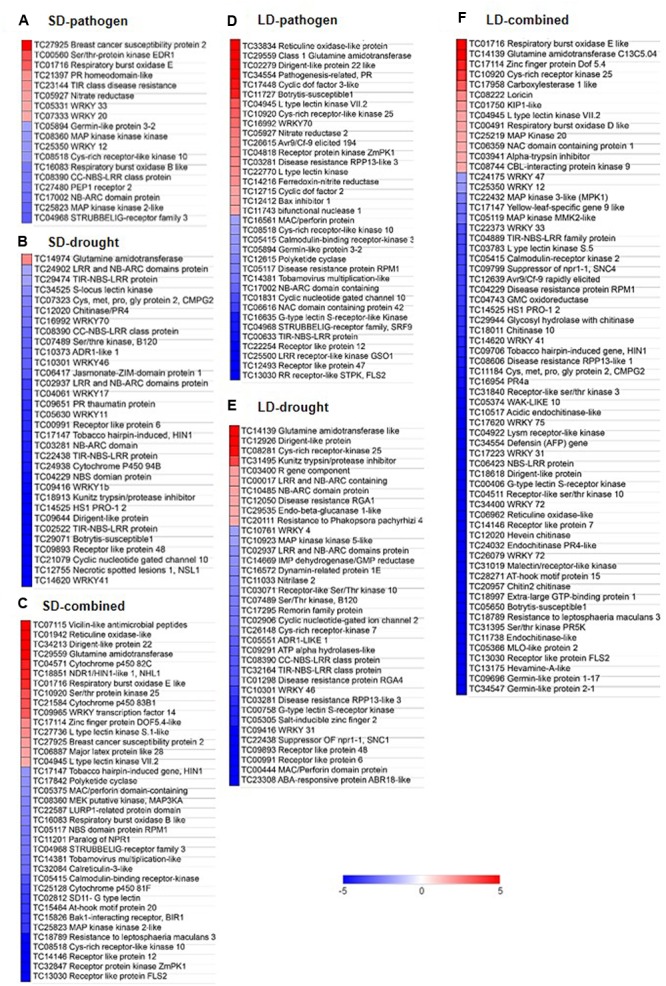
FIGURE 7.

Expression profile of genes involved in defense responses under individual and combined stress transcriptome. DEGs with minimum fold change 1 (Log2 converted) were identified in each individual and combined stressed plants over their respective controls. DEGs involved in defense responses were identified using MAPMAN software and literature survey. Heat map represent expression profile of ‘defense response related’ genes under SD-pathogen (A), SD-drought (B), SD-combined (C), LD-pathogen (D), LD-drought (E), and LD-combined stresses (F). Fold change values (over respective controls) are represented in heat maps where color bar in red and blue represents up- and down-regulated genes, respectively.
