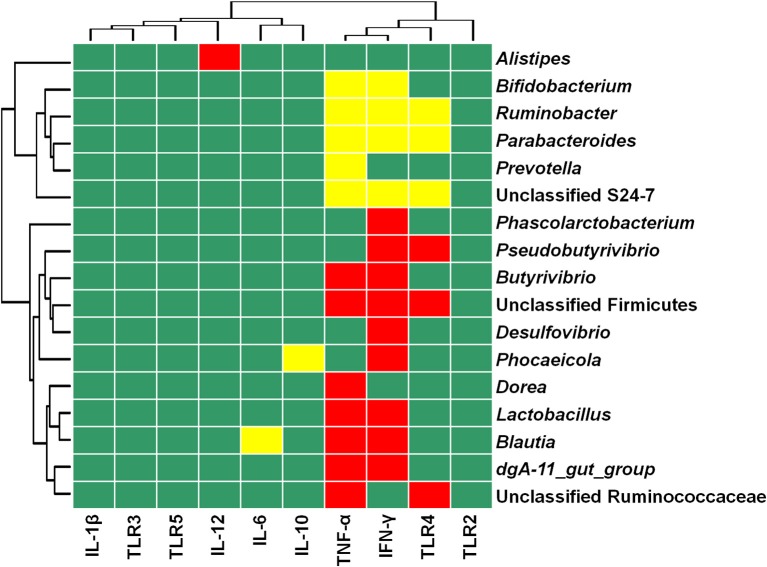
Figure 4.
Heat map showing the correlation between the relative abundances of bacterial taxa and mRNA expression in colonic mucosa. The top 50 bacterial taxa were selected to perform the correlation analyses, and those significantly associated with TLR and cytokines are shown. Cells are colored based on Spearman's correlation coefficient. Red represents a significant positive correlation (P < 0.01), yellow represents a significant negative correlation (P < 0.01), and green represents a non-significant correlation (P > 0.01).

