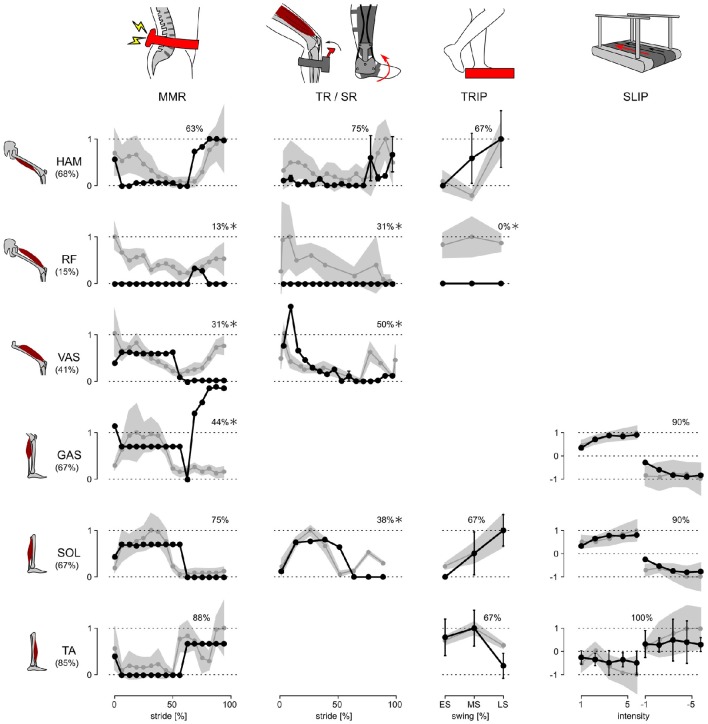
Figure 2.
Response trends. The responses of the model and human subjects in all five disturbance experiments are shown. Human responses (gray lines) are normalized with respect to their maximum value in each experiment and for each muscle. The model responses (black lines) are linearly scaled to place as many of the responses as possible within ±1 s.d. of the human responses (gray shaded area). The % of the model responses within ±1 s.d. of human responses are shown at the top of each graph, and those which are ≤50% are marked with *.

