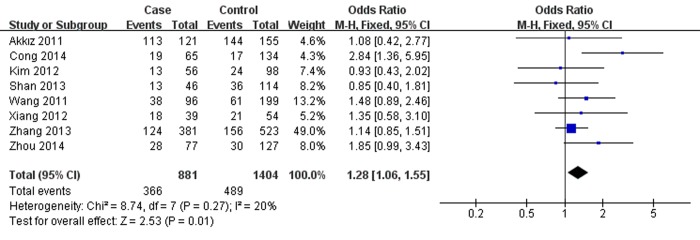
Figure 1.
Forest plot describing the association between miR-146a rs2910164 and hepatitis virus-related HCC risk under homozygous model (GG vs. CC). The squares and horizontal lines correspond to the study-specific OR and 95% CI. The area of the squares reflects the weight (inverse of the variance). The diamond represents the summary OR and 95% CI. M–H: Mantel–Haenszel; df: degrees of freedom; Events: the number of GG genotypes.

