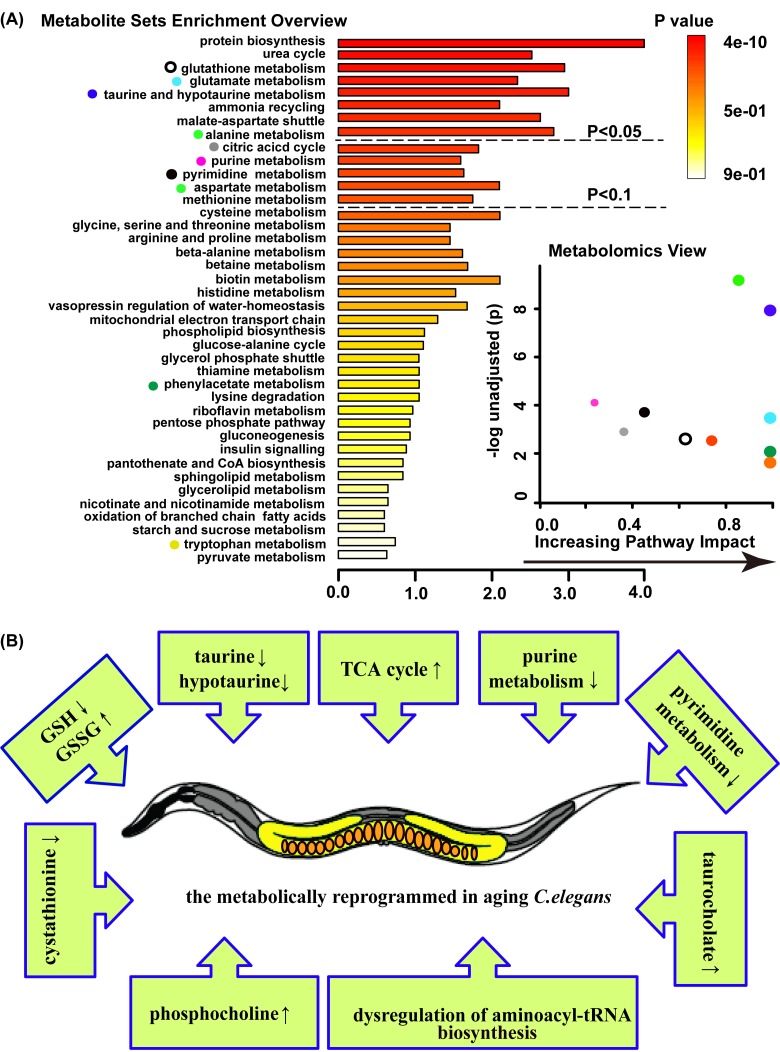
Figure 2. Age-related metabolic remodeling in C. elegans.
(A) Summary plot for metabolite enrichment analysis(MSEA) (left panel), where metabolite sets were ranked according to Holm p-value, and the cut off of Holm p-value showed with hatched lines (the panel overviews metabolites repeated measured by Mann-Whitney U test, p<0.05). Metabolomics view (right panel) reflects key nodes in metabolic pathways that have been significantly altered with aging, and in which x-axis reflects the increasing metabolic pathway impact according to the between centrality measure. MSEA was performed using package global test and the metabolome view displayed the pathway topological analysis. (B) Model on the aging C. elegans response entails a complex series of metabolic change.

