
Fig. 1.
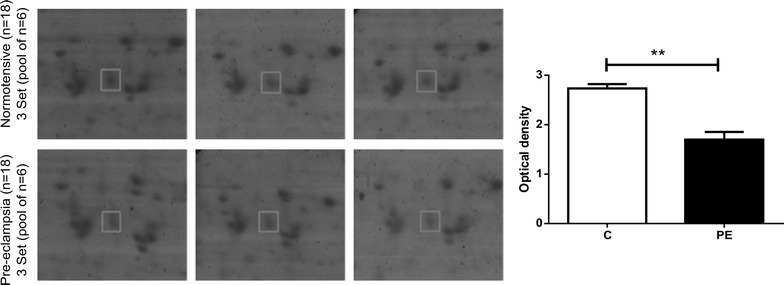
Magnified images of differentially expressed TINAGL1 spots. The bar chart represents mean ± SE of the optical density of the spot for the three sets of normotensive (C) and pre-eclamptic (PE). **p < 0.01
Official websites use .gov
A
.gov website belongs to an official
government organization in the United States.
Secure .gov websites use HTTPS
A lock (
) or https:// means you've safely
connected to the .gov website. Share sensitive
information only on official, secure websites.
Magnified images of differentially expressed TINAGL1 spots. The bar chart represents mean ± SE of the optical density of the spot for the three sets of normotensive (C) and pre-eclamptic (PE). **p < 0.01