
Fig. 2.
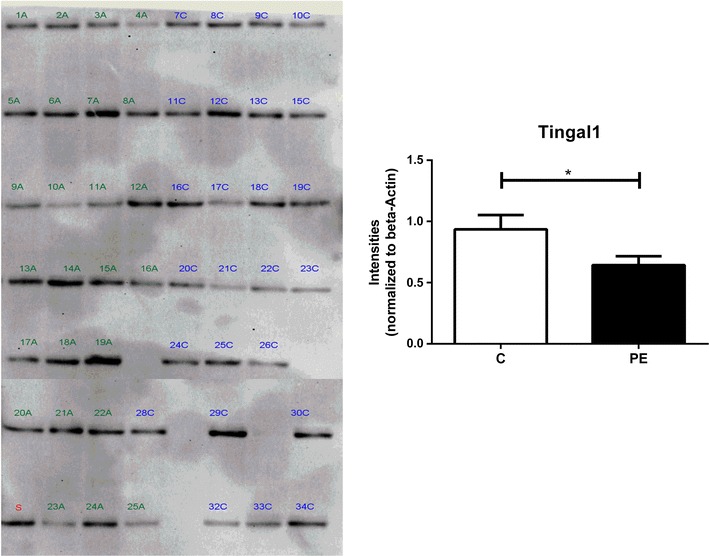
Western blot for tubulointerstitial nephritis antigen-like 1 protein. In the image, PE samples are marked with A (1–25A) and normotensive with C (7–34C), and standard sample (S) made by pooling all the individual sample. The graph represents intensities of normotensive (C) and pre-eclamptic pregnancies (PE) normalized to beta-actin. The bar represents mean ± SE of 25 each individual of the normotensive and pre-eclamptic placenta (*p < 0.05). Additional file 2: Table S1 shows the calculation for beta-actin normalization