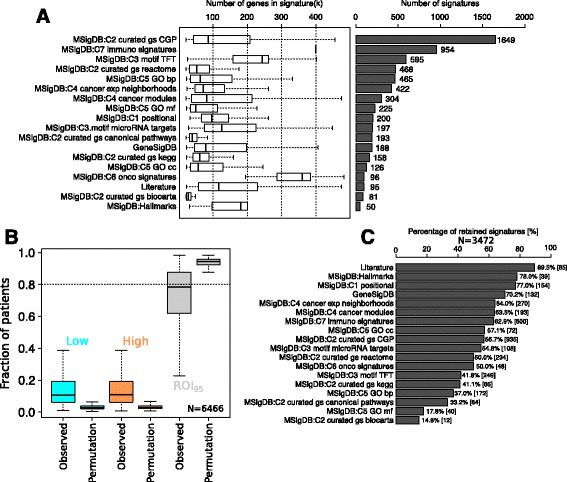
Fig. 2.

Selection of the informative list of 3472 gene signatures. a Distribution of the number of genes per signature and overall number of signatures from each sources of signatures. b Distribution of the proportion of patients assigned to the low, independent and high classes by the region of independence (ROI)95 computed for all signatures and obtained after random permutation of gene labels over the Molecular Taxonomy of Breast Cancer International Consortium (METABRIC) dataset. c Percentage of informative signatures for each of the different sources
