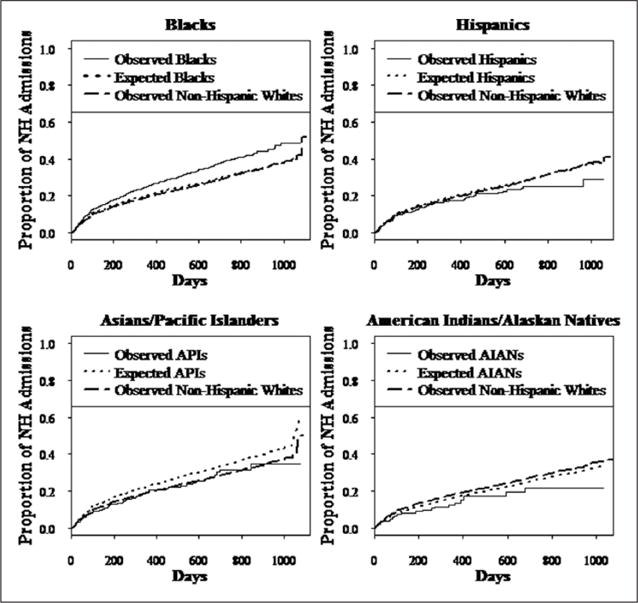
Figure 1.

Survival curves of time to a pressure ulcer after nursing home admission.
Note. Compared with the proportion of each race/ethnic group that is expected to develop a pressure ulcer (dotted line), the observed proportion of Black admissions (solid line) was significantly more likely to develop a pressure ulcer and develop one sooner (p< .001). Hispanic (p = .04) and Asian/Pacific Islander (Asian; p = .01) admissions were less likely to develop a pressure ulcer and developed one later than expected. There was no significant difference in the observed versus expected proportion of American Indians/Alaskan Native (American Indian; p = .18) who developed a pressure ulcer over time. The proportion of White Non-Hispanic residents in the mixed race nursing homes observed to develop a pressure ulcer is also shown (dashed-dotted line). Analyses are adjusted for individual and nursing home/community predictors.
