
Fig. 5.
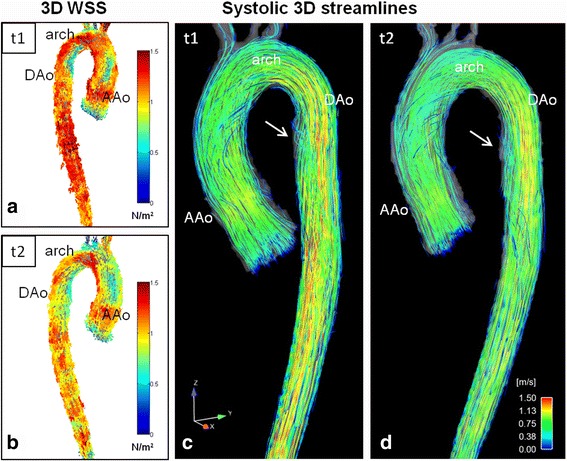
Hemodynamics in a Marfan patient at baseline t1 and at follow-up t2 after 3 years. a) and b): WSS along the aortic surface at t1 (a) and t2 (b) depicts a normal WSS distribution which was consistent with volunteers. C) and d): flow visualization by streamlines during late systole/early diastole. There are only slight helices (white arrows) in the normal sized DAo which were assessed as grade 1 both at t1 and t2. AAo = ascending aorta, DAo = descending aorta