Fig. 3.

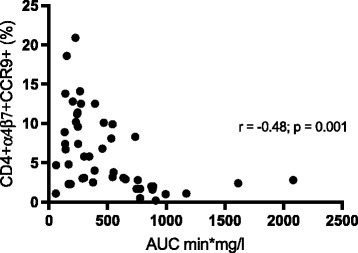
Percentage of CD4 + α4β7 + CCR9+ T lymphocytes was inversely correlated (r = -0.5; p = 0.001) with gastric emptying as reflected by paracetamol absorption (area under the curve (AUC) min*mg/l)

Percentage of CD4 + α4β7 + CCR9+ T lymphocytes was inversely correlated (r = -0.5; p = 0.001) with gastric emptying as reflected by paracetamol absorption (area under the curve (AUC) min*mg/l)