
Fig. 3.
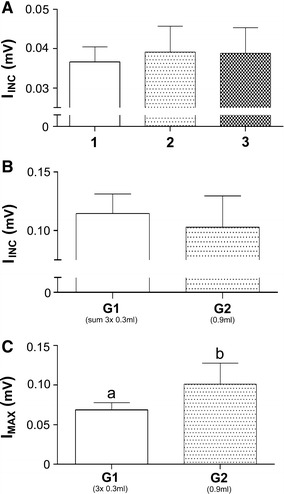
A IINC detected for each injection in G1. B Comparison of sum of IINC in G1 and IINC in G2. C Comparison of IMAX reached in each group. Different letters indicate significant differences between groups (p < 0.05)
Official websites use .gov
A
.gov website belongs to an official
government organization in the United States.
Secure .gov websites use HTTPS
A lock (
) or https:// means you've safely
connected to the .gov website. Share sensitive
information only on official, secure websites.
A IINC detected for each injection in G1. B Comparison of sum of IINC in G1 and IINC in G2. C Comparison of IMAX reached in each group. Different letters indicate significant differences between groups (p < 0.05)