
Fig. 5.
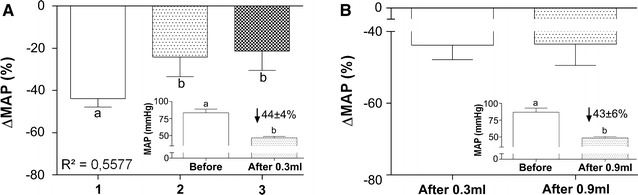
Effects of MNP administration on arterial pressure. A Percentage of MAP drop after each injection in G1. (Inset) Mean arterial pressure before and after the first injection in G1. B Percentage of MAP drop after the sole injection in G2. (Inset) Mean arterial pressure before and after the injection in G2. Different letters indicate significant differences between groups (p < 0.05)