
Fig. 6.
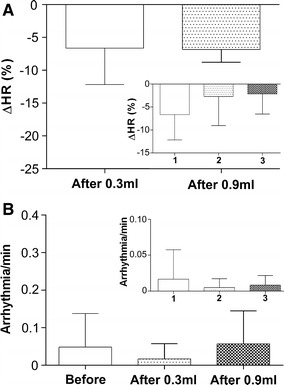
Percent variation in HR and quantification of arrhythmia events after MNP administration. A Percent variation in HR measured after the first injection in G1 and after the sole injection in G2. (Inset) Variation in HR for each injection in G1. B Arrhythmia events quantified before and after the first MNP injection in G1 and after the sole injection in G2. (Inset) number of arrhythmia events for each injection in G1