Fig. 10.

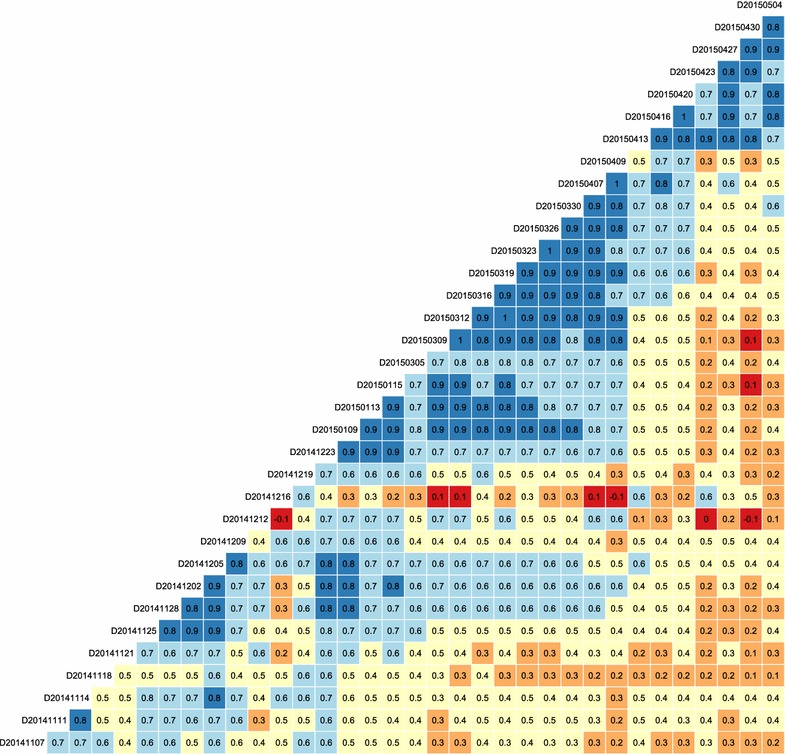
Correlation (r) matrix showing the correlations of canopy cover between different measurement times for an entire growing season. Labels on the diagonal indicate the dates of measurements

Correlation (r) matrix showing the correlations of canopy cover between different measurement times for an entire growing season. Labels on the diagonal indicate the dates of measurements