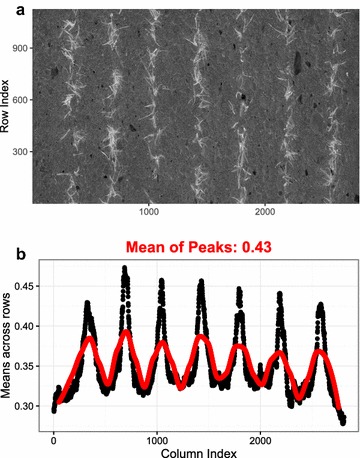
Fig. 2.

Automated thresholding on a calculated NDI3 image (a) by averaging across image rows (b, n = the size of image height). Black dots show the row-mean values along with the image column index, and red line is the smoothed spline indicating the positions for peaks and troughs that are detected for the row-means (μRow)
