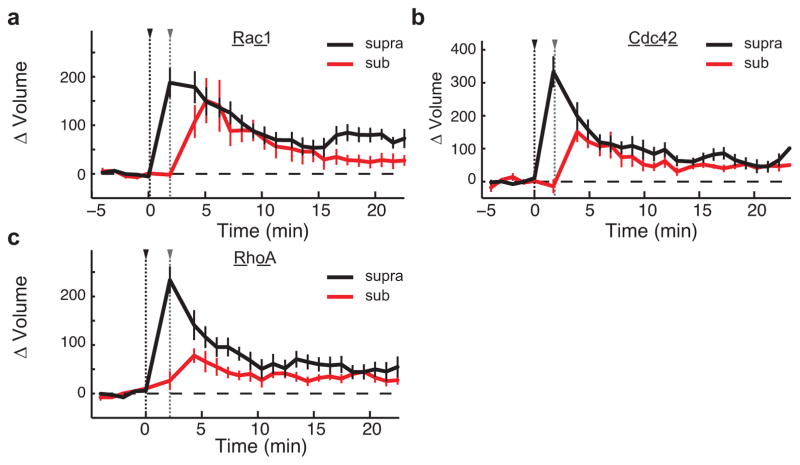
Extended Data Fig. 10. Change in volume of paired spines during synaptic crosstalk in Rho GTPase-expressing CA1 neurons.
a. Spine volume change in response to a suprathreshold (black curve; black arrow indicates stimulus initiation) and a paired subthreshold (red curve, gray arrow indicates stimulus initiation) stimulus in spines from cells expressing the Rac1 sensor. n = 6 cells/12 crosstalk experiments. Error bars represent s.e.m.
b. Same as (a), but for Cdc42-expressing cells. n = 9 cells/10 crosstalk experiments.
c. Same as (a and b), but for RhoA-expressing cells. n = 8 cells/12 crosstalk experiments.

