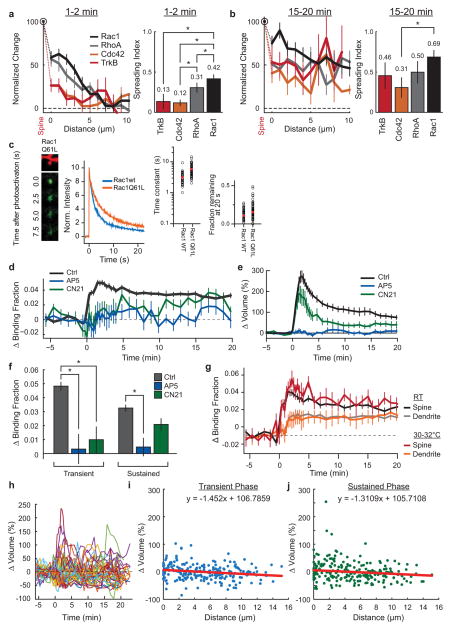
Extended Data Fig. 2. Characterization of the Rac1 sensor during single spine structural plasticity in hippocampal slices.
a. (left) Comparison of the signal spreading of Rac1, RhoA, Cdc42, and TrkB, normalized to spine activity from 1–2 minutes post stimulus onset. Error bars represent s.e.m. Data corresponds to that shown in Fig. 1 (Main Text). (right) Comparison of the spreading indices of the four sensors (Spreading Index = Activity in dendrite (1–5 μm) from 1–2 minutes post-stimulation/maximum spine activation). Error was estimated by bootstrapping. Asterisks indicate a statistically significant difference as deteremined by an independent-samples t-test (p<0.05).
b. Same as (a), but for 15–20 min post stimulation.
c. Analysis of the diffusion time constants of constitutively active (Q61L) and wild-type Rac1 using photo-activatable GFP (paGFP). (left) Representative 2p images of paGFP-Rac1Q61L in a single dendritic spine after photo-activation. While active Rac1 shows a slightly slower diffusion that Rac1(wt) (middle), both Rac1Q61L and Rac1(wt) diffuse away from the spine with approximately equal diffusion time constants (right two plots; wt: n = 41 spines/4 cells; Rac1Q61L: 67 spines/7 cells).
d. Pharmacological characterization of Rac1 signal during sLTP. Rac1 activation in control (ctrl; n = 102 cells/121 spines) conditions during 2p-glutamate uncaging, in the presence of the NMDA receptor blocker APV (APV; 100μM; n = 6 cells/13 spines), and in the presence of the cell-permeable CaMKII inhibitory peptide tatCN21 (CN21; 10μM; n = 5 cells/11 spines). Error bars represent s.e.m.
e. Time course of spine volume change for experiments (d). Error bars represent s.e.m.
f. Summary of effect of AP5 and CN21 on the transient (1–2min post stimulation; Ctrl ΔBF = 0.049±0.003; +AP5 ΔBF = 0.00±0.01; +CN21 ΔBF = 0.01±0.01) and sustained (10+minutes post stimulation; Ctrl ΔBF = 0.033±0.002; +AP5 ΔBF = 0.006±0.007; +CN21 ΔBF = 0.026±0.05) phases of Rac1 activation during sLTP. Error bars represent s.e.m. Asterisks indicate a statistically significant difference as determined by an independent samples t-test (p<0.05).
g. Effects of near-physiological temperature of Rac1 sensor activation. Perfusion was warmed with a heating block holding the ACSF container, and the temperature measured at the back of the perfusion chamber. (RT = room temperature, n = 102 cells/121 spines; for 30–32°C, n = 11 cells/13 spines). Error bars represent s.e.m.
h. Variability of unstimulated spine volume changes after the induction of sLTP in a nearby spine in Rac1 sensor-overexpressing neurons. Data shown are timecourses of unstimulated spines close to the site of sLTP induction. While there is no average change in nearby spine volume with this stimulus (Fig. 1c, Main Text), there is occasional enlargement or shrinkage. Data corresponds to 100 randomly selected spines from the total of 777 nearby spines measured for the average depicted in Fig. 1c.
i. Transient (1–2min) change in volume of nearby spines as a function of distance from the stimulated spine. Data correspond to all nearby spines measured for the experiments in which the spatial profile of Rac1 was measured (n = 56 cells/79 experiments/218 nearby spines; Fig 1e, Main Text). Inset equation corresponds to the linear model of best fit.
j. Same as (i), but for the sustained (10–20 min) change in volume of nearby spines.

