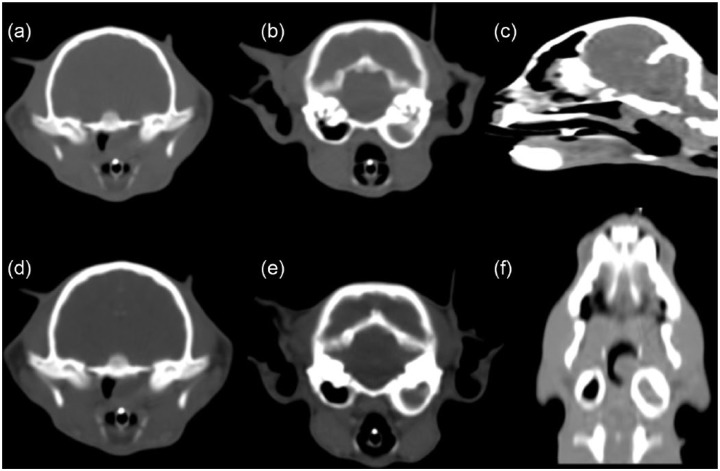
Figure 2.
Computed tomography of the head. (a) Note the non-enhanced images demonstrating the soft tissue dense nasopharyngeal mass lesion. (b) Note the soft tissue density within the expansile left tympanic cavity with thickening of the osseus bulla. (c) Sagittal reconstructed planar image demonstrating the nasopharyngeal mass. (d–f) Postcontrast administration; minimal enhancement was noted. Note the soft tissue densities within the left tympanic cavity and the nasopharynx

