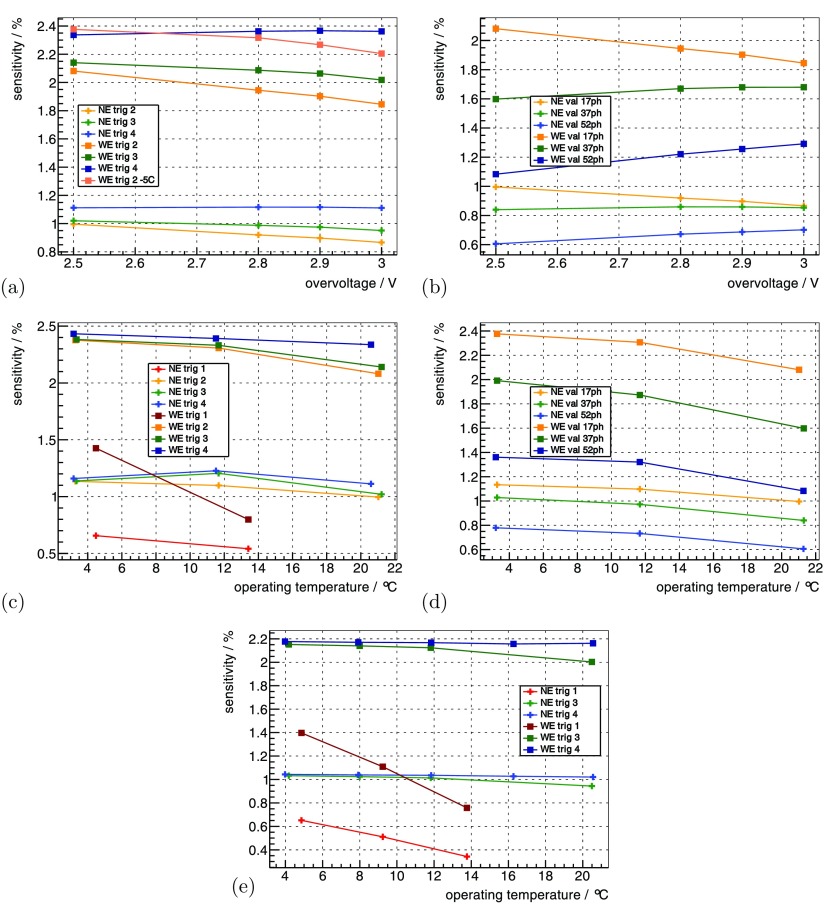
Figure 7.
The sensitivity for the 22Na point sources (table 2) is shown as a function of in (a) for different trig and in (b) for different val. It is shown for a constant as a function of in (c) for different trig and in (d) for different val. For a constant , it is shown as a function of in (e) for different trig. (a) °C, . (b) °C, trig 2. (c) const , V, . (d) const , V, trig 2. (e) const V, .

