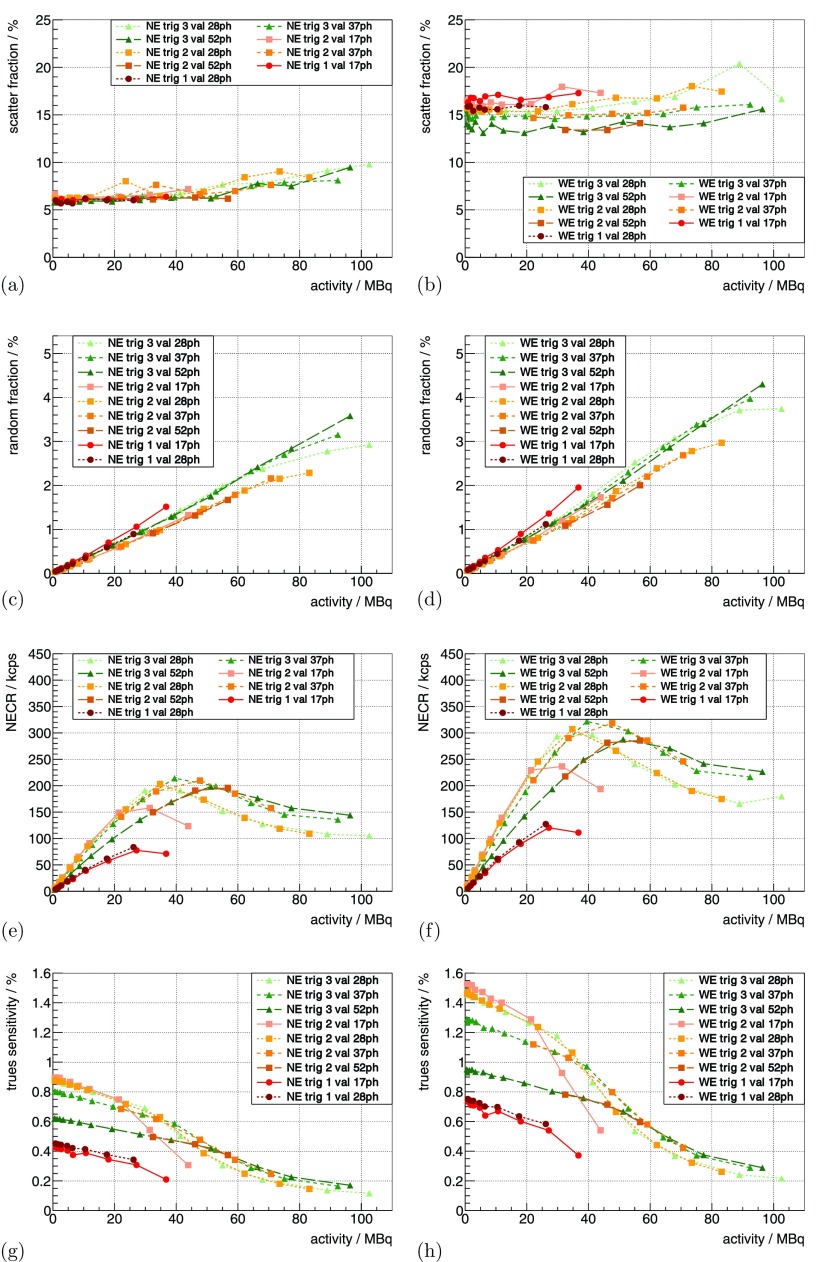
Figure 8.
(a) and (b) show the scatter fraction curves for the mouse-sized scatter phantom for a constant V and °C for different trig and val. The two bands for the different energy windows can clearly be distinguished. For the same measurement, (c) and (d) show the random fraction, (e) and (f) the NECR curves and (g) and (h) the trues sensitivity.

