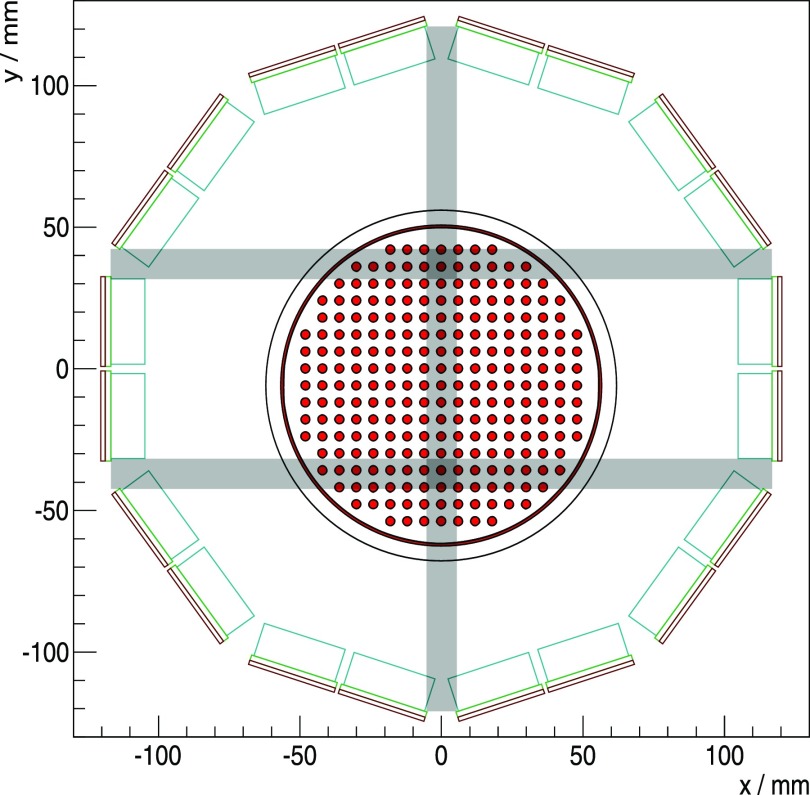
Figure 13.
Transversal cross section through the gantry. The LYSO crystal array outlines are drawn in light blue, and the light guide in green; the sensor tile is sketched in red. The rabbit-sized phantom is shown at the measured untilted position, which is not centered along the y-axis. The gaps in the horizontal and vertical direction are plotted in gray, parallel to the symmetry axes of the Cartesian grid of the phantom and intersecting the activity distribution.

