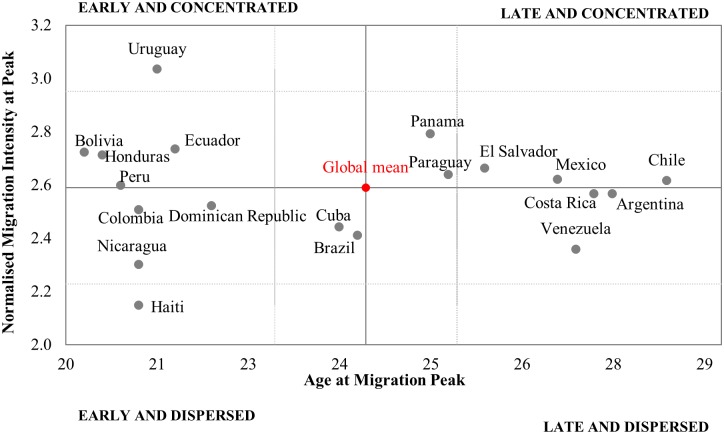
Fig 2. Age at migration peak against normalised migration intensity at peak.
Source: IMAGE Repository. Note: Measured were derived from migration data disaggregated by single years of age, normalised to unity, and smoothed using Kernel regression [53]. Global mean was estimated for sample of 25 countries encompassing all world regions [3]. Gridlines are located 0.5 standard deviations from the global mean.

