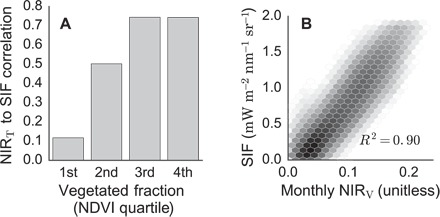
Fig. 1. SIF relates to NIRV through surface vegetated fraction.

(A) The correlation between NIRT and SIF increases with vegetated fraction. The upper bounds of the NDVI quartiles are as follows: 0.17, 0.27, 0.37, and 0.72. (B) NIRV closely proxies multiyear monthly averaged SIF. All data calculated using 2008–2010 GOME-2 data averaged monthly and regridded to 0.5°. Shading indicates the logged number of pixels within each bin.
