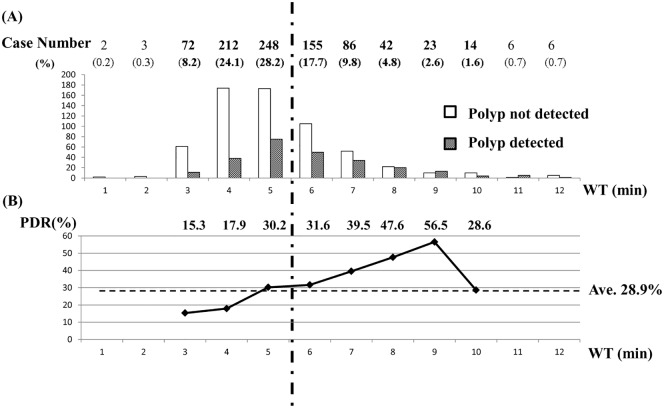
Fig 2. Case number with or without polyp detection, and PDR per each value of WT (min).
(A) The left white and right dotted bar graph show case number without polyp detection and with polyp detection, respectively, per each value of WT (minutes). The number of colonoscopy examination per each value of WT, and the percentage of that divided by the total number (n = 878) is indicated above the bar graphs. (B) The polygonal line graph displays PDR per each value of WT. Individual PDR per each value of WT is indicated above the graph. The average PDR for 878 subjects was 28.9%.

