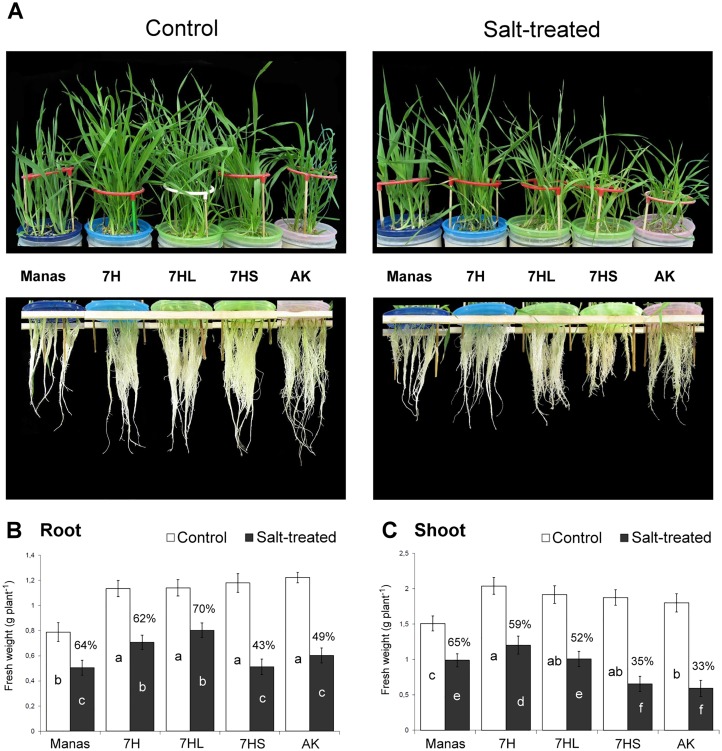
Fig 1. Growth responses of different genotypes grown in hydroponic solution with or without salt treatment.
Typical plant phenotypes (A), and the root (B) and shoot (C) weights determined at the end of the experiments. Data are means ± SD of 25 replicates per treatment and genotype. Salt-induced growth reduction was indicated as a % of the control. Different letters indicate significant differences between the genotypes at P < 0.05 using Tukey’s post hoc test.

