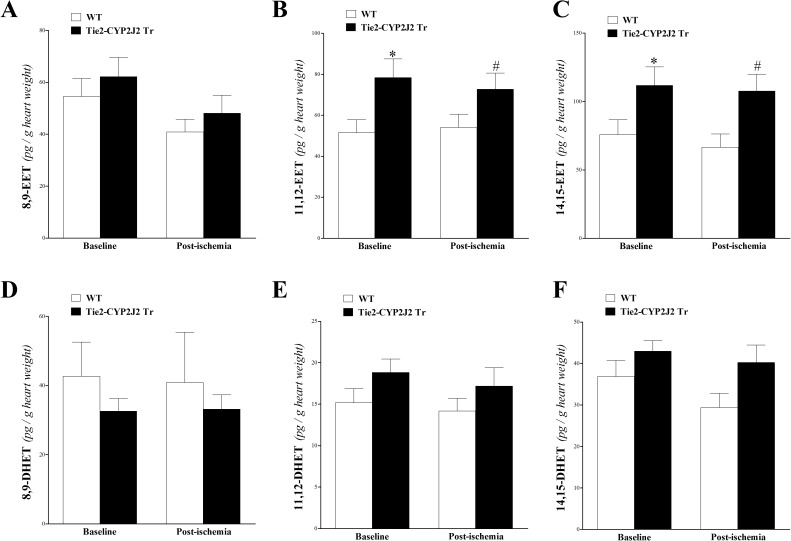
Fig 2. LC–MS/MS analysis for EETs’ (8, 9–, 11, 12–, and 14, 15–) and DHETs’ (8, 9–, 11, 12–, and 14, 15–) levels in WT and Tie2-CYP2J2 Tr mouse heart perfusates at baseline and post-ischemia.
11,12-EET (B), and 14,15-EET (C) were increased in Tie2-CYP2J2 Tr compared to WT mice (P < 0.05), whereas 8,9-EET (A) was not significantly different between the two groups (P > 0.05). 8,9-DHET (D), 11,12-DHET (E), and 14,15-DHET (F) were not significantly different between WT and Tie2-CYP2J2 Tr mice. Also, the levels of EETs and DHETs were not affected in response to ischemia in either mouse genotype (P > 0.05). * P < 0.05 versus baseline WT. # P < 0.05 versus WT post-ischemia. n = 12 per group.

