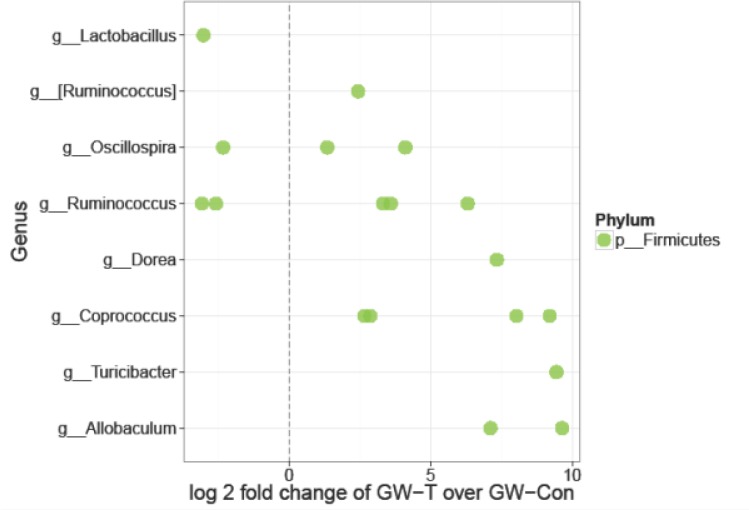
Fig 3. Differentially abundant features in GW-T vs. GW-Con: Each point represents an OTU belonging to each Genus.
Features were considered significant if their FDR-corrected p-value was less than or equal to 0.05, and the absolute value of the Log-2 fold change was greater than or equal to 1. There were 109 significantly different features detected out of 577 tests. Only 18 features that were able to be classified at the genus level are shown in the plot.

