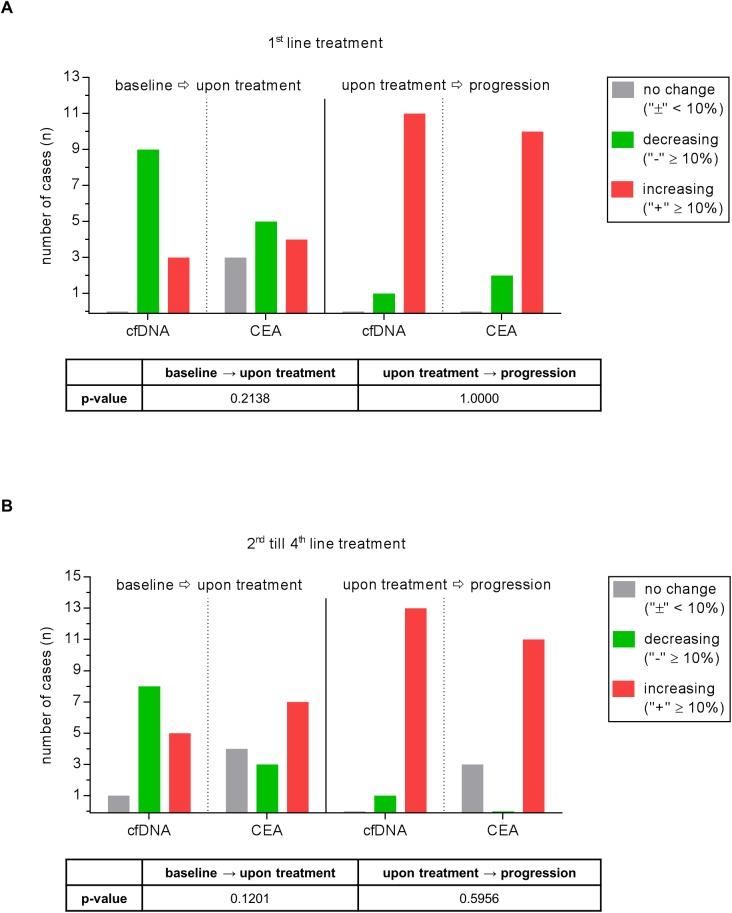
Fig 3. Comparison of the power of cfDNA and CEA course to reflect the course of disease.
Values are depicted for both therapy naïve patients (A) and patients during further therapy lines (B). A change in cfDNA amount of ≥10% is considered as “increase” /”decrease”. A change in value <10% is defined as “no change”.

