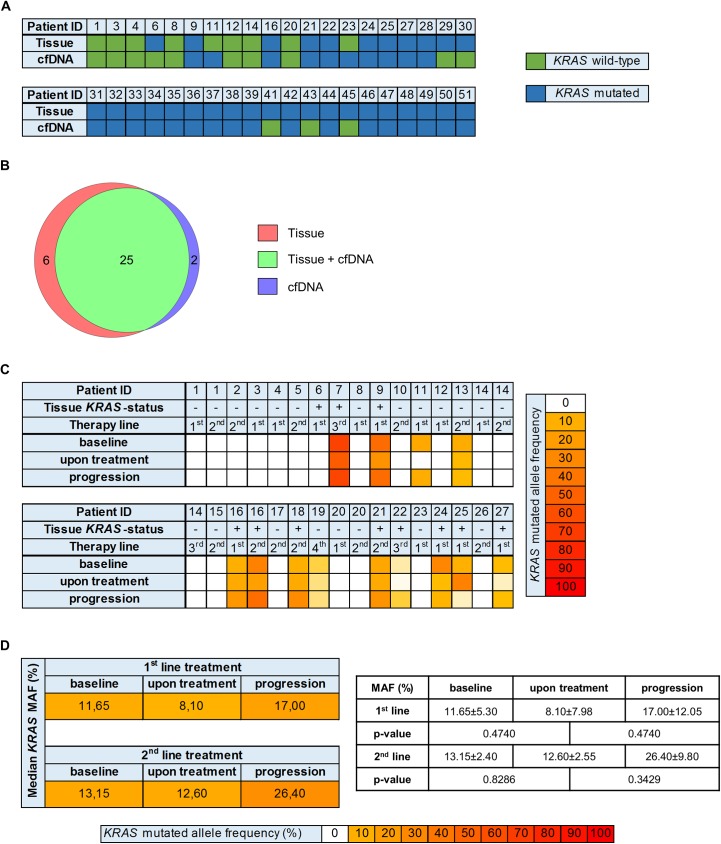
Fig 4. KRAS genotyping of cfDNA.
(A) KRAS mutational status per patient for tissue and cfDNA analysis at time-point of initial diagnosis (n = 40, all: therapy naïve). (B) Venn diagram showing that 25 KRAS mutations, detected in tumor tissue could also be found in cfDNA, 6 were only present in tumor tissue and 2 only in cfDNA. (C) KRAS mutated allele frequencies in cfDNA under treatment per patient and therapy line. (D) Median KRAS mutated allele frequencies (MAF) in 1st and 2nd line treatment group at the respective time-points.

