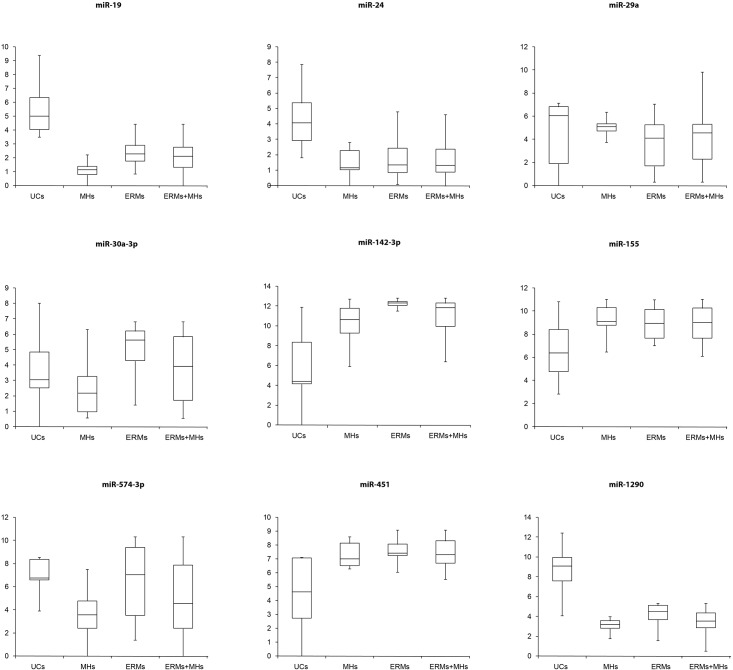
Fig 1. Box Plots of differentially expressed miRNAs.
Box Plots from Single TaqMan® Assays on TaqMan® Low Density Arrays (TLDA) of differentially expressed miRNAs. Validation by single TaqMan® assays of differentially expressed miRNAs identified by TLDAs in the vitreous humor of all the patients and controls. Values on the y-axis are reported as ΔCt × (−1).

