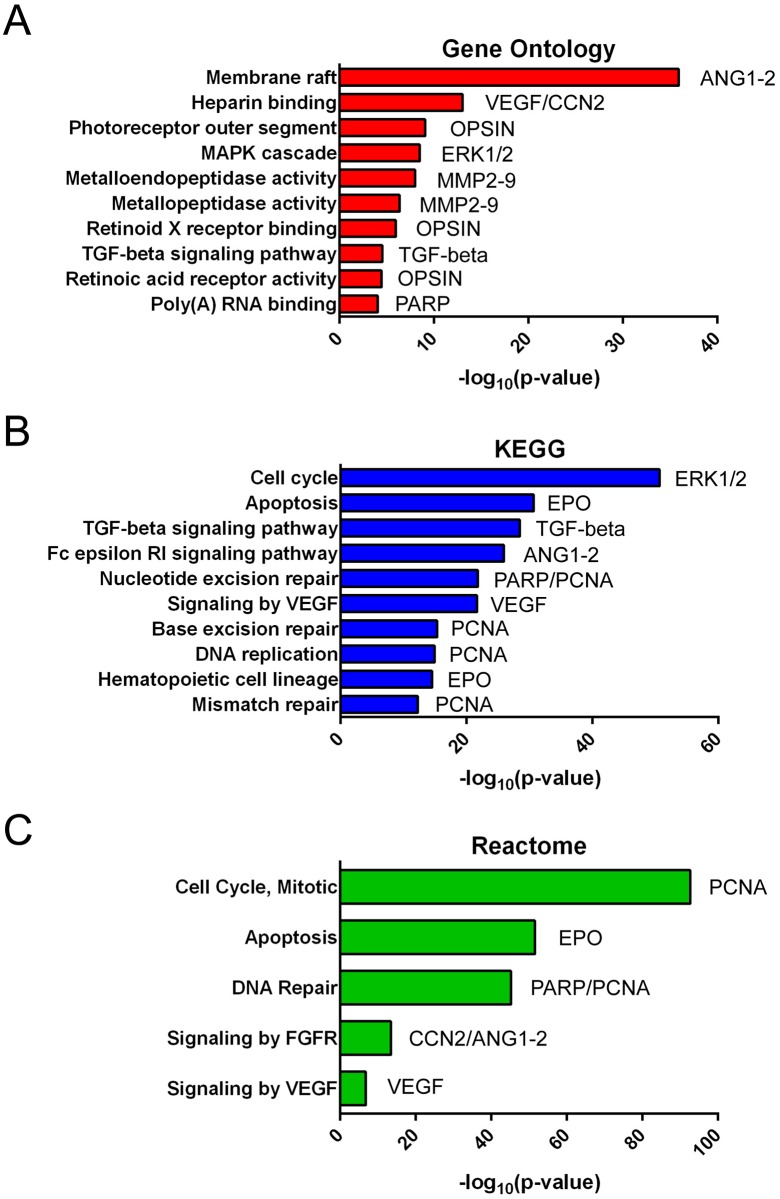
Fig 2. Biological processes controlled by miR-19b, miR-24 and miR-142-3p network.
Overrepresented biological functions from a molecular network built on validated targets of differentially expressed miRNAs, retrieved from different annotation databases (GO, KEGG, Reactome). On the left of each histogram the overrepresented pathways are reported, while on the right the corresponding associated genes to MHs and ERMs based on literature data are shown. Data are plotted as—log10 of p-values for each biological process.

