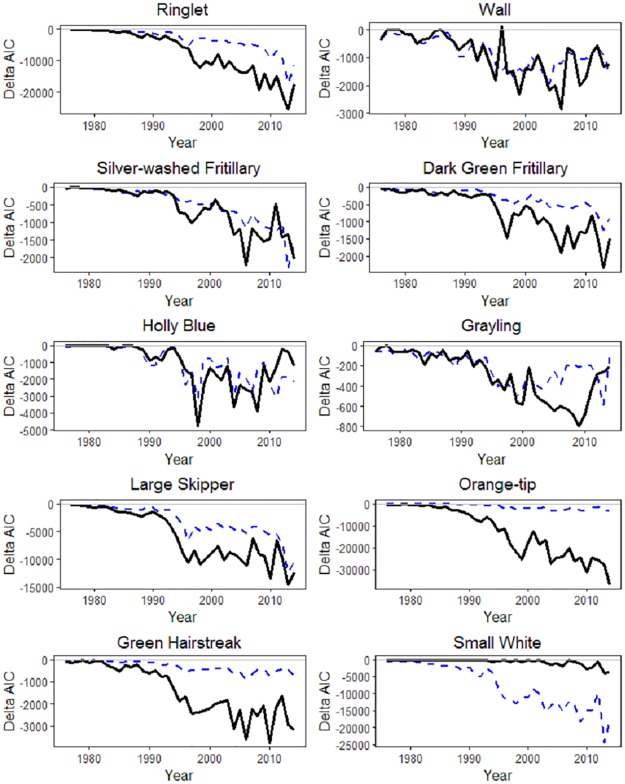
Fig 2. AIC comparison using varying covariates for detection probability.
The solid black line compares having the seasonal covariate and list length as two covariates, rather than with just list length. The dashed blue line compares having the seasonal covariate and list length as two covariates, rather than with just the seasonal covariate.

