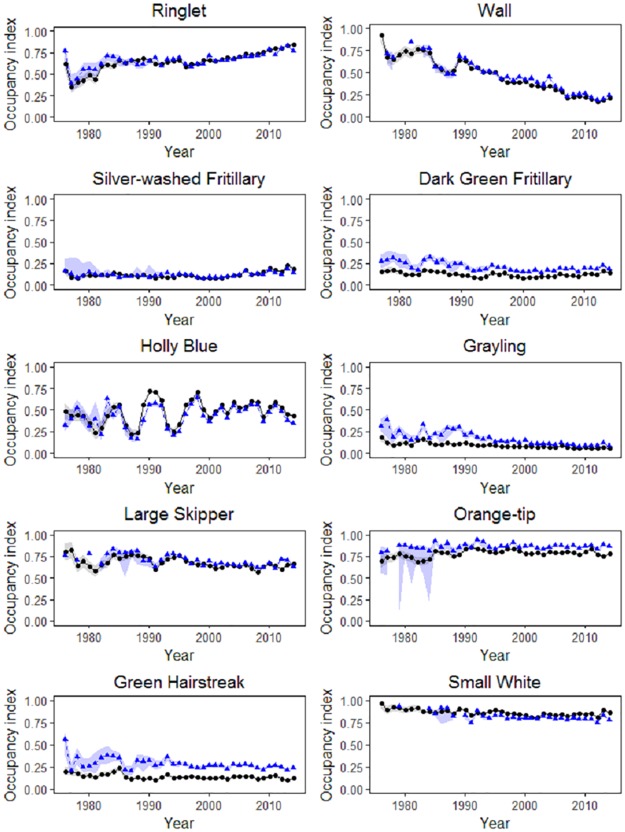
Fig 3. Index Comparison for models B (black, circles) and C (blue, triangles).
The 95% confidence bands follow directly from the MCMC of the Bayesian analysis and from an approximate bootstrap approach in the classical case. In model C, detection probability has two covariates, the seasonal covariate and list length, and the data are restricted in date.

