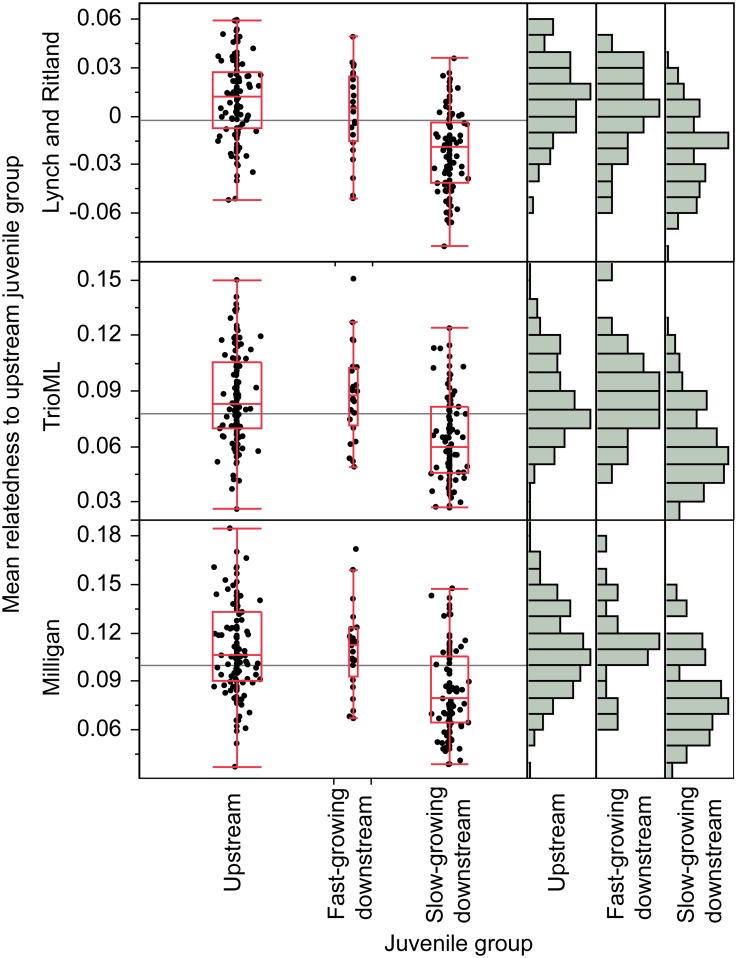
Fig 3. Mean relatedness of upstream (n = 124), fast-growing downstream (n = 25) and slow-growing downstream (n = 98) juvenile individuals with the upstream group.
Kruksal-Wallis tests indicated significant differences (p<0.0001) for all three strong estimators (Lynch and Ritland, TrioML, Milligan). Steel Dwass All Pairs method consistently indicated that the slow-growing downstream juveniles were significantly less related to the upstream group than were the upstream and downstream fast-growing juveniles (S4 Table). Data are summarized using box plots and frequency distributions.

