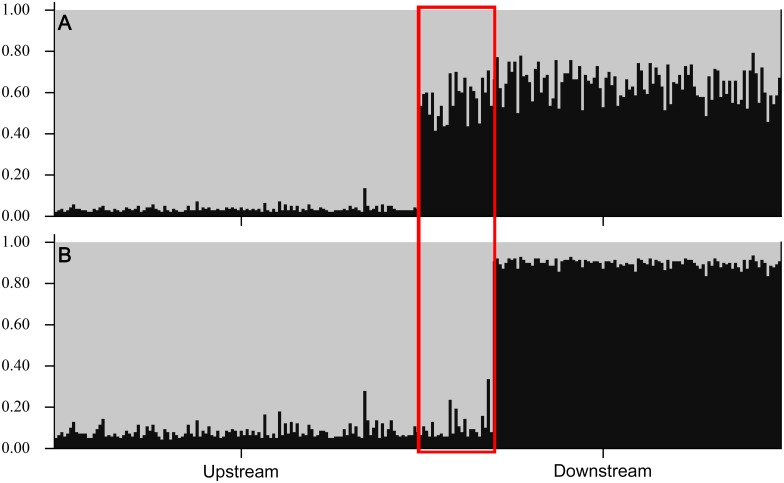
Fig 5. STRUCTURE bar-plots for individual based Bayesian analyses of membership proportions for upstream (n = 124) and downstream (n = 123) sampled juvenile Lake Sturgeon.
The two most likely scenarios, (A) k = 2, sampling location as prior (2nd most likely), and (B) k = 2, length-at-age as prior (most likely), are shown. The ordering of individual juveniles is identical for both plots; from left to right, upstream juveniles, fast-growing downstream juveniles (red highlights), and slow-growing downstream juveniles.

