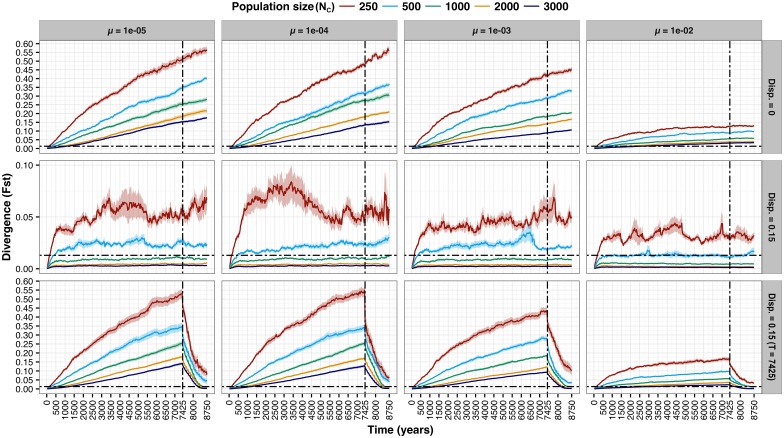
Fig 7. Results of population divergence simulations (scenarios 1, 2, and 3) conducted in RMETASIM. FST versus time (years) is plotted based on the 25 year increment mean values derived from 32 simulation replicates conducted for each population size (as shown in the legend), microsatellite mutation rate, and dispersal combination.
Shading represents 95% confidence intervals. Vertical hatched lines reflect the timing of construction of the Slave Falls GS (~ 7,425 years after glacial recession). Horizontal hatched lines reflect the level of FST observed empirically between upstream and downstream populations after fast-growing outliers were removed from the downstream juvenile group.

