. 2017 Feb 23;6:e23082. doi: 10.7554/eLife.23082

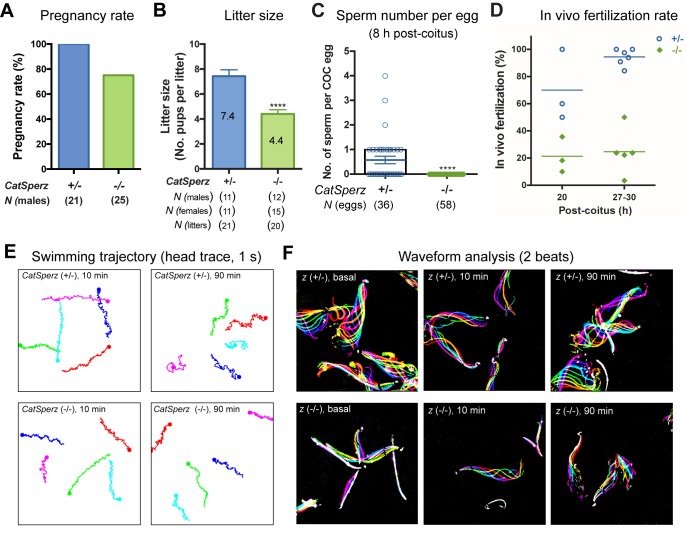
Figure 2. Deletion of the mouse CatSperζ subunit severely impairs male fertility.

(A) Percent pregnancy rate over three months. (B) Average litter size resulting from CatSperz+/- (7.4 ± 0.5) and CatSperz-/- (4.4 ± 0.3) males. (C) Sperm number per egg at the fertilization site 8 hr after 1 hr window-timed coitus with CatSperz+/- (0.58 ± 0.15) and CatSperz-/- (0, none) males, quantified from eggs collected from ampullae. (B) and (C) Data are mean ± SEM. ****p<0.0001. (D) In vivo fertilization rate: Scatter plot with mean % of 2 cell fertilized eggs from CatSperz+/- (70% and 94.4%) and CatSperz-/- (21.3% and 24.6%) mated females at 20 and 27–30 hr after coitus, respectively. (E) Head trace of free swimming CatSperz+/- (top) and CatSperz-/- (bottom) sperm cells at 10 min (left) and 90 min (right) after capacitation. Traces are from 1 s movies taken at 37°C. (F) Flagellar waveform traces. Movies recorded at 200 fps: CatSperz+/- (top) and CatSperz-/- (bottom) sperm cells attached on glass coverslips before capacitation (left), and 10 min (middle), and 90 min (right) after capacitation. Overlays of flagellar traces from two beat cycles are generated by hyperstacking binary images; time coded in color. See also Figure 2—figure supplements 12 and Figure 6—figure supplement 1.

DOI: http://dx.doi.org/10.7554/eLife.23082.007

Figure 2—source data 1. Impaired male fertility in CatSperz-/- mice: pregnancy rate, litter size, sperm number per egg, and in vivo fertilization rate.
DOI: 10.7554/eLife.23082.008

Figure 2.

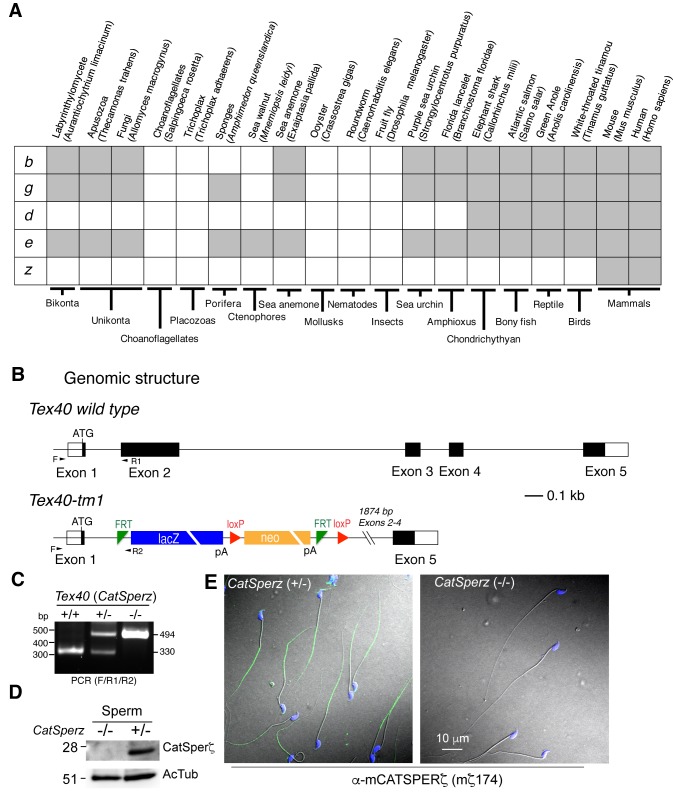
Figure 2—figure supplement 1. Generation of CatSperz-/- mice, related to Figure 2.

Figure 2—figure supplement 1.

(A) Distribution of CatSper subunits in eukaryotes. (B) ES cells (Project ID: CSD33943) from the KOMP Repository were used to produce KO mice. Exons 2–4 deleted by gene trap. (C and D) Genotyping (primers F/R1/R2) (C) and immunoblotting (D) analysis of CatSperz-/-. (E) Normal sperm morphology despite the absence of ζ protein in CatSperz-/- spermatozoa. Overlay of confocal images and the corresponding phase-contrast images of mouse sperm cells from CatSperz+/- and CatSperz-/- mice immunostained with mζ174 (also used in (D) and Figure 1F and H. The principal piece labeling is not observed in CatSperz-null sperm, validating the specific subcellular distribution of the signal to the sperm tail. Hoechst dye stains the sperm head DNA (blue).
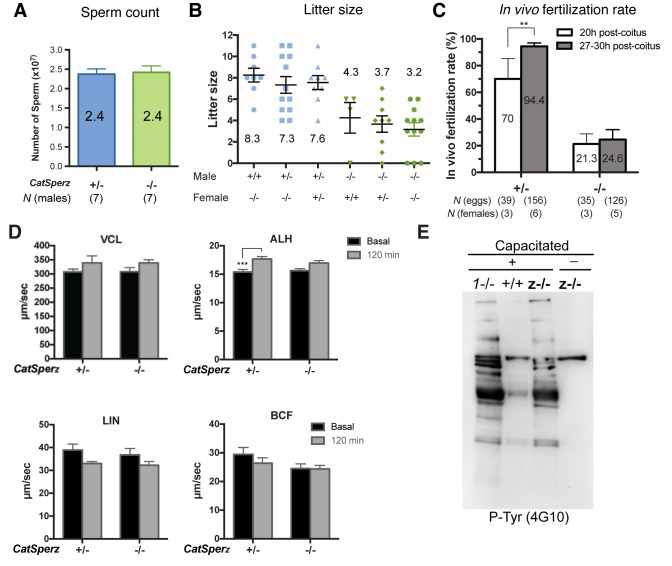
Figure 2—figure supplement 2. Sperm count and fertility of CatSperz-/- mice; sperm motility analysis and development of P-Tyr, related to Figures 2 and 3.

Figure 2—figure supplement 2.

(A) Epididymal sperm count (mean ± SEM) from littermates at ages 2–3 months. CatSperz het (+/-, blue; 2.4 ± 0.1) versus null (-/-, green; 2.4 ± 0.2) cells (107). (B) Average litter size from all males in the mating test, grouped by male and female genotype. (C) IVF rate calculated by counting fertilized eggs (2 cell stage) 20 and 27–30 hr after coitus. Data are expressed as a scatter plot of mean percentage from CatSperz+/- (20 hr, 70 ± 15; 27–30 hr, 94.4 ± 2.5) and CatSperz-/- (20 hr, 21.3 ± 7.6; 27–30 hr, 24.6 ± 7.4). **p=0.0097 (One-way ANOVA and F test). See also Figure 2D. (D) Sperm motility parameters measured by computer assisted sperm analysis (CASA) from CatSperz het (+/-) versus null (-/-) male mice. 5 min (basal, gray) and 90 min (capacitated, black) after incubation in HTF. ALH of CatSperz+/- (basal, 15.5 ± 0.4; 120 min, 17.3 ± 0.4, p=0.0002). Data are mean ± SEM. N = 4. (E) Capacitation-associated protein tyrosine phosphorylation of CatSperz -/- spermatozoa.
Figure 2—figure supplement 2—source data 1. Impaired male fertility in CatSperz-/- mice: sperm count, litter size per genotype, in vivo fertilization rate, and CASA parameters.
DOI: 10.7554/eLife.23082.011