. 2017 Mar 22;6:e20851. doi: 10.7554/eLife.20851

Figure 2. Normal aging is characterized by a diastolic decline with preserved contractility.

Various cardiac functional parameters presented by age in a combined w1118 and Canton S dataset, n = 18 to 30 animals per time-point: (A) Median heartbeat with heart rate (inset). (B) Estimated cardiac output per second (blue) and per stroke (red). (C) Median heart wall velocity with peak velocities of contraction (red dots) and relaxation (blue dots). (D) Probability histograms of the time from initiation of contraction to peak contraction velocity (red) and from the peak contraction velocity to peak relaxation velocity (blue). The shaded areas in panel B represent the mean +/− s.d., with regressions plotted as dotted lines.

DOI: http://dx.doi.org/10.7554/eLife.20851.005

Figure 2—source data 1. Median heartbeats for all individual animals in panel A.
Median heartbeats were calculated for individual animals (Table) and for all consolidated heartbeats for a respective age (Panel A and last column of each Table). These source data provide a representation of the observed heartbeat waveform variability between animals.
elife-20851-fig2-data1.xlsx (552.4KB, xlsx)
DOI: 10.7554/eLife.20851.006

Figure 2.

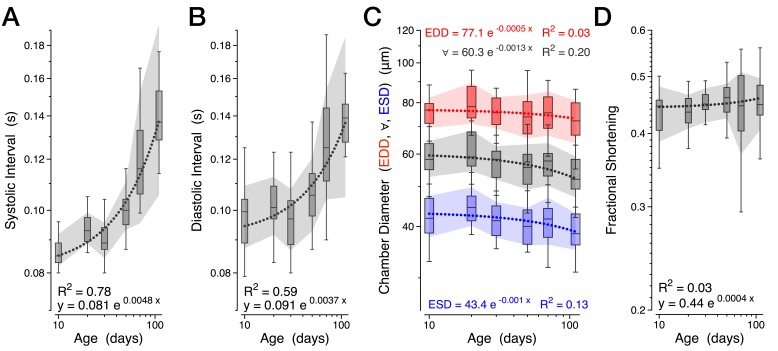
Figure 2—figure supplement 1. Further measures of normal aging.

Figure 2—figure supplement 1.

Various cardiac functional parameters presented by age in a combined w1118 and Canton S dataset, n = 18 to 30 animals per time-point: (A) Systolic interval. (B) Diastolic interval. (C) Heart chamber diameter across the cardiac cycle (∀, grey) with median end systolic diameter (ESD, blue) and end diastolic diameter (EDD, red) during aging. (D) Fractional shortening. The shaded areas are mean +/− s.d. with the dotted lines representing the best fit of each dataset (y = Aekx).