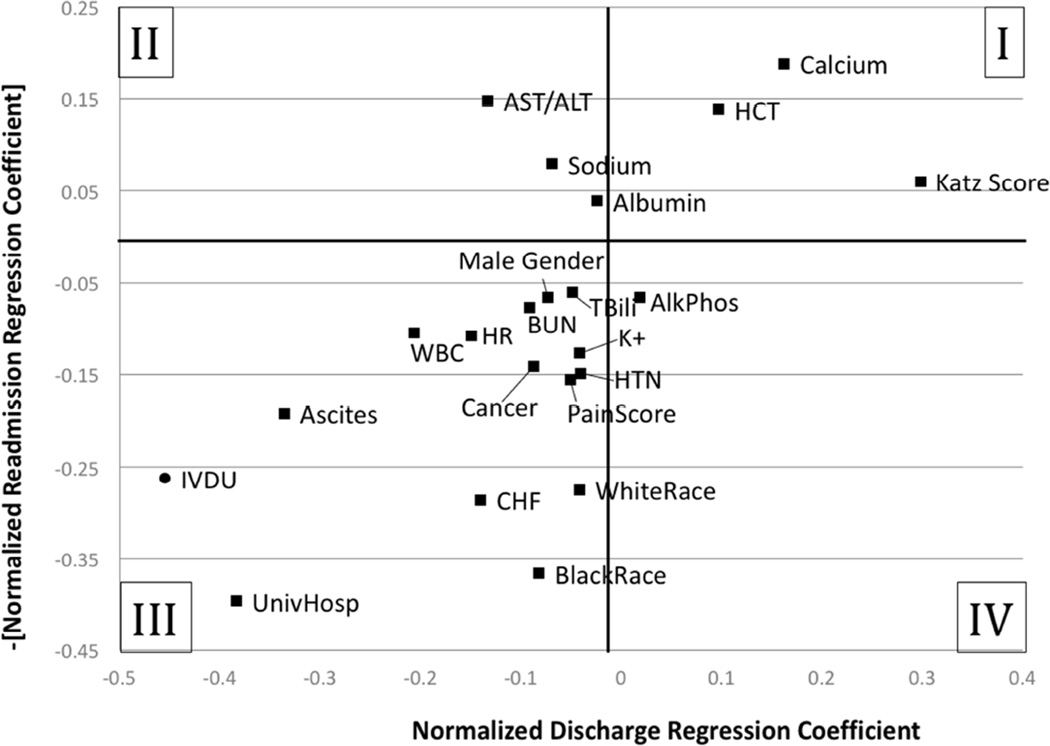
Figure 1. Comparison of the effect of observed clinical variables on predictive models of discharge and readmission.
The x-axis plots the normalized regression coefficient of a time-to-event model of the likelihood of discharge for a given day’s observed clinical variables. The y-axis plots the normalized coefficient of a logit regression model of the likelihood of 30-day readmission. The sign of the readmission regression coefficient has been reversed for easier direct comparison of the variable’s effect on discharging the patient (larger regression coefficient is a higher likelihood of discharge) versus the variable’s effect on preventing readmission (larger regression coefficient is a lower likelihood of readmission). In its current projection, Quadrant I demonstrates variables that both increase the likelihood of discharge and reduce the risk of readmission; Quadrant III demonstrates variables that decrease the likelihood of discharge and increase the risk of readmission. Quadrants II and IV represent discordance between behavior and readmission with the former indicating variables that increase length of stay but reduce the risk of readmission and the latter indicating variables that decrease length of stay but increase risk of readmission. Variables found to be statistically insignificant with either model are not shown.

