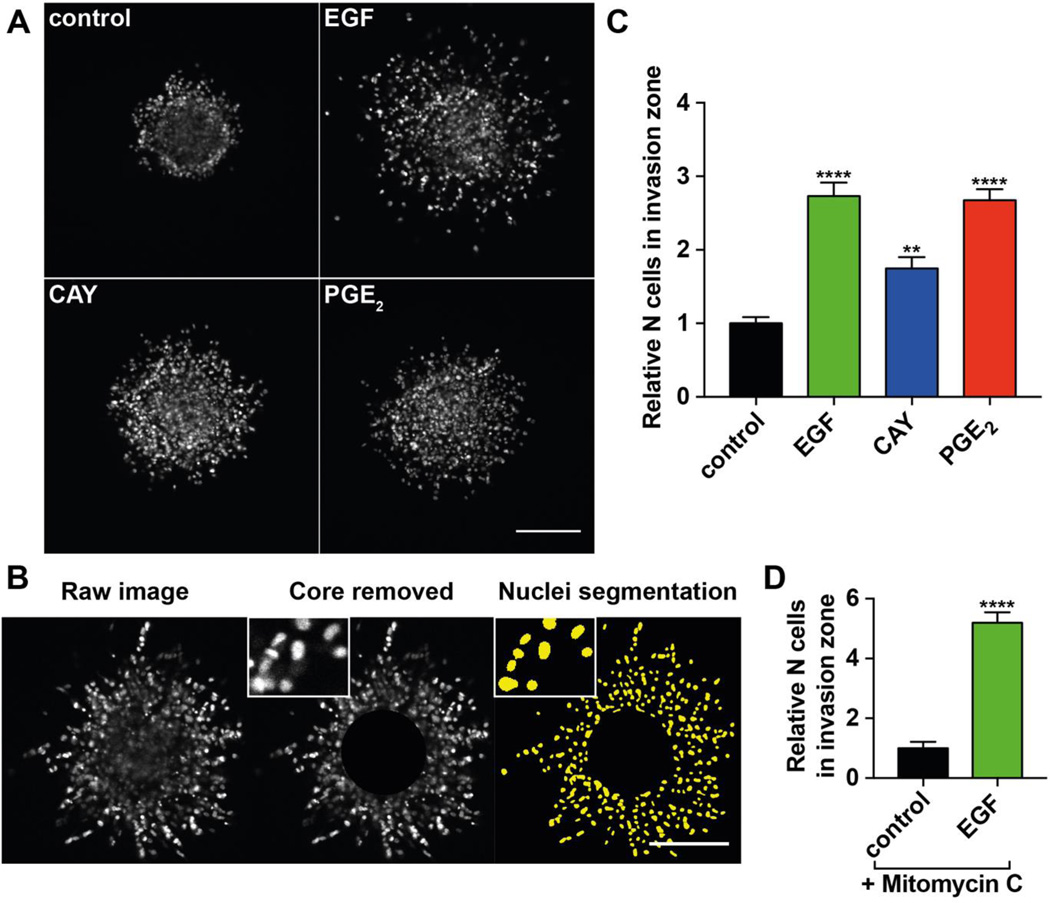
Figure 2. Spheroid invasion assay.
(A) Representative images of MDA-MB-231 spheroids (1,000 cells) embedded in collagen I (5 mg/ml). Control spheroid treated with 1 nM DMSO and spheroids stimulated with 1 nM EGF, 10 nM CAY10598 (CAY) or 1 µM PGE2 for 48 h were fixed and stained with DAPI. Scale bar= 200 µm. (B) Image processing workflow. The core of the spheroid was removed leaving only the cells in the invasion area for quantification. The nuclei were segmented and counted. (C) Quantification of cells in the invasion zone of spheroids shown in (A). Values present the mean + SEM of 15 – 25 spheroids per condition. One-way ANOVA was used for the statistical analysis. The asterisks show the significance of the difference compared to the DMSO control. ** P<0.01; **** P<0.0001. (D) Invasion assay in the presence of cell proliferation-inhibiting agent Mitomycin C (1 µg/µl). Values present the mean + SEM of 6 spheroids per condition. Students t-test was used for the statistical analysis. The asterisks show the significance of the difference compared to the DMSO control. **** P<0.0001.

