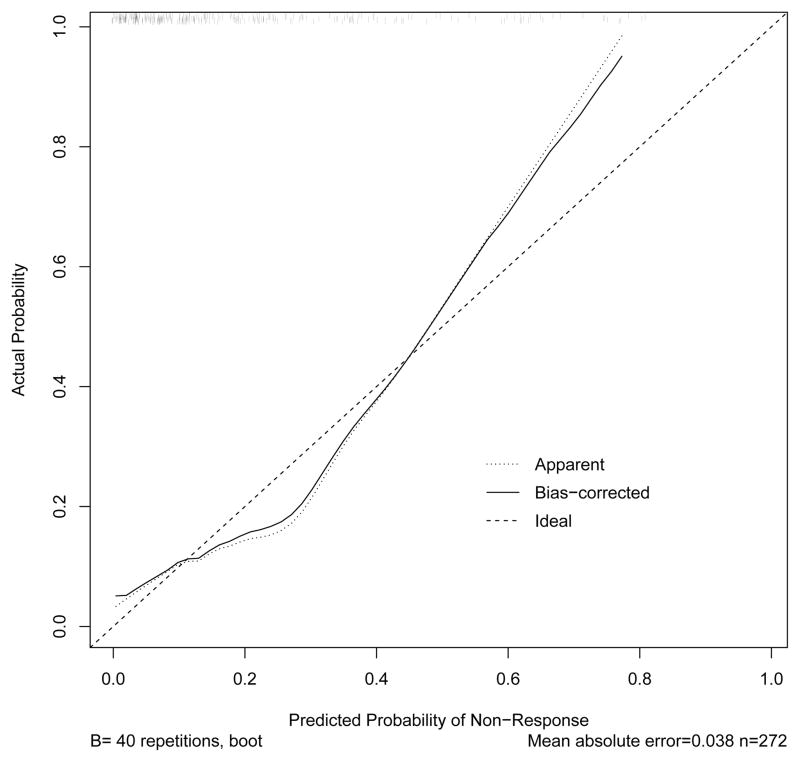
Figure 2.
The OAI data were used to generate the calibration curve. The observed probability of nonresponse is presented on the y-axis and the regression-predicted probability of non-response is presented on the x-axis. The diagonal line indicates perfect agreement between the observed and predicted probability of nonresponse. Deviation from perfect agreement occurs at beginning, middle and end of the curve.

