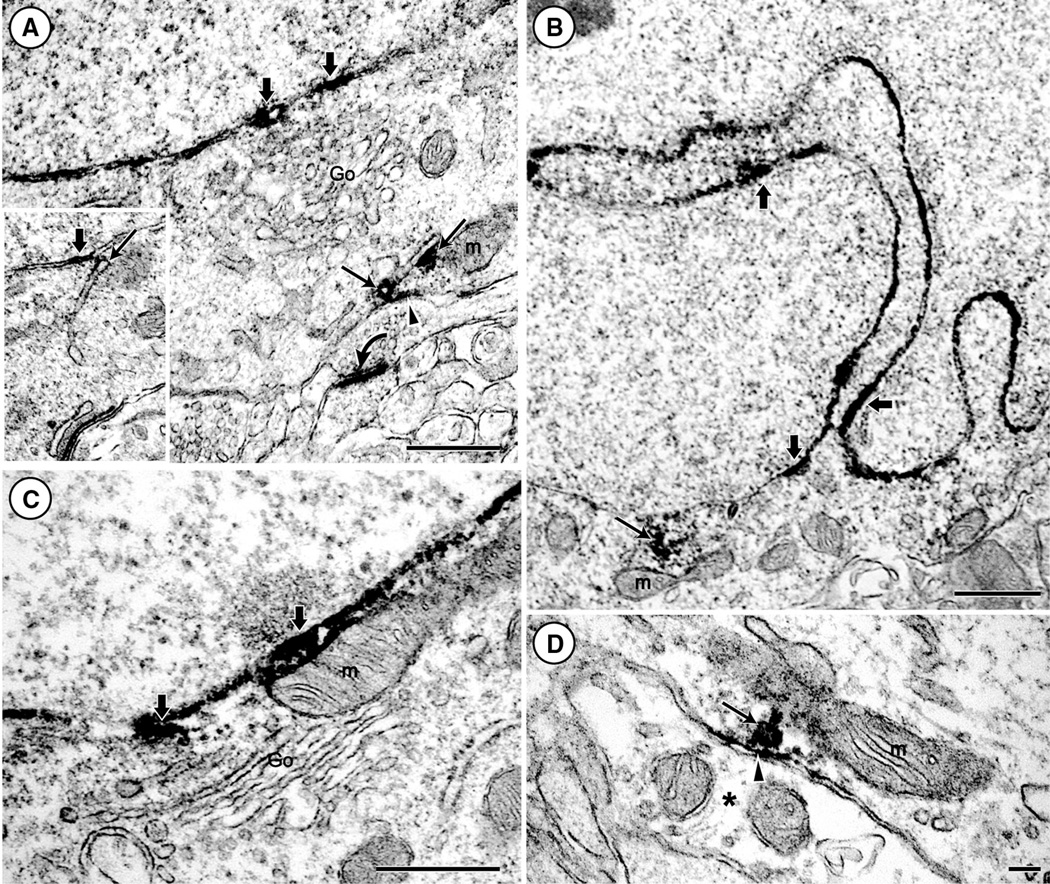
Fig. 7.
Electron microscopic images showing immunoperoxidase labeling for OCT3 in somatodendritic profiles in the rat (a, c, d) and mouse (b) BLA. The peroxidase reaction product (block arrows) is unevenly distributed along a round unindented (a, c) and a heavily indented (b) nuclear membrane in somata that also show plasmalemmal (arrow head) and endomembrane (thin arrows) distributions of OCT3 immunoreactivity near a mitochondrion (m) in a and b. The immunolabeled soma in a is opposed to an unlabeled axon terminal forming an asymmetric axospinous synapse (curved arrow in a). In d, the OCT3 plasmalemmal labeling (arrowhead) is located in a proximal dendrite that is opposed by an unlabeled astrocytic process (asterisk). In this dendritic profile, the peroxidase reaction product (thin arrow) is also distributed along a vesicle-like cytoplasmic organelle located between the plasma membrane and a nearby mitochondrion (m). Go Golgi apparatus, m mitochondrion, Nuc nucleolus. Scale bar 500 nm in a–c and 100 nm in d

