
Figure 6. Cell invasion in three normal PC cell lines with the same cell intensity.
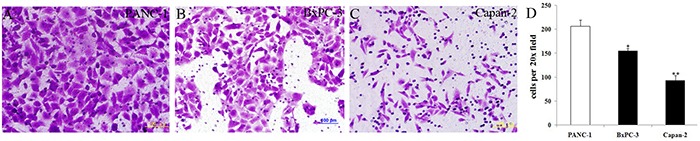
a–d. With the same cell intensity of three PC cells, cell invasion was high in PANC-1 (a), moderate in BxPC-3 (b), and low in Capan-2 (c) cell lines, respectively. Bars indicate ± S.E.*, P <0.05; **, P <0.01 compared with the control.