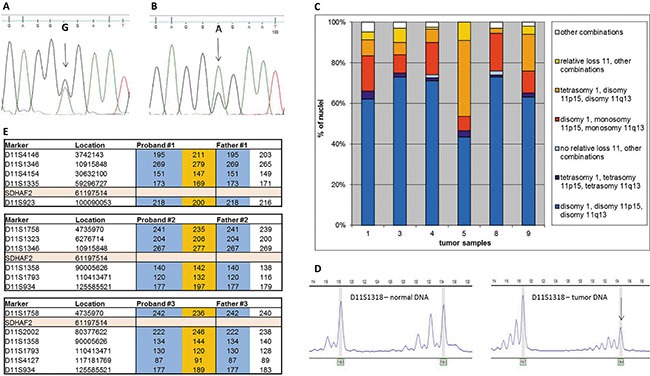
Figure 1. Sanger sequencing of SDHAF2 in normal (A) and tumor (B) DNA.

Arrows indicate the relevant nucleotides in the heterozygous patient. (C) Interphase FISH results from isolated whole nuclei isolated from paraffin-embedded material of 6 SDHAF2-related patients. Frequency distribution of signals obtained with probes for centromere 1 (PUC1.77), telomere 11p (371C18) and telomere 11q (469N6). (D) A typical profile of microsatellite marker alleles showing loss of heterozygosity. Arrows indicate the allele lost. (E) Chromosome 11 haplotypes of family members. Microsatellite markers are shown with genomic location and the position of SDHAF2 is indicated. Alleles in orange blocks represent the probable disease haplotype, present in the proband and absent in the father. Alleles in blue blocks represent alleles from the father.
