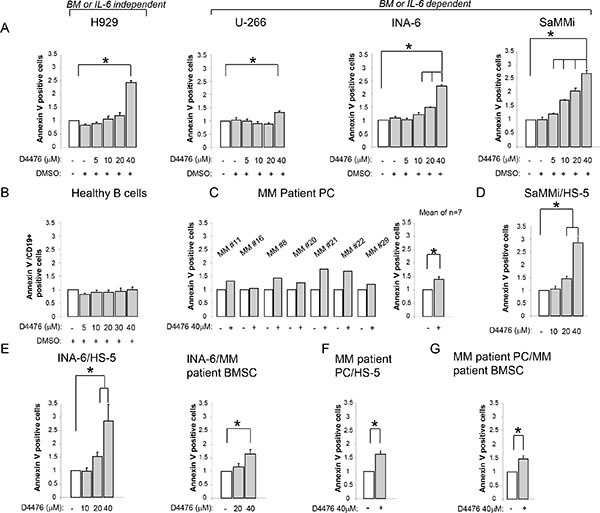
Figure 2. Effects of CK1 inhibition on MM cell survival.

Quantification of apoptosis through Annexin V staining and FACS analysis in various models of MM cells treated with different concentrations of D4476 (ranging from 5 to 40 μM) for 48 h: (A) MM cell lines H929, U-266, INA-6, SaMMi; (B) average of 6 purified healthy B cells; (C) 7 independent CD138+ MM patient PCs (MM#11, MM#16, MM#8, MM#20, MM#21, MM#22, MM#29); (D) SaMMi cultured on HS-5 stromal cells (SaMMi/HS-5); (E) INA-6 cultured on HS-5 stromal cells (INA-6/HS-5) and on patient derived BMSCs (INA-6/MM patient BMSC); (F–G) patient derived CD138+ plasma cells cultured on HS-5 (MM patient PC/HS-5) or on MM patient derived BMSCs (MM patient PC/MM patient BMSC). Data represent the mean ± SEM of 3-6 (A), six (B), seven (C), six (D) four-six (E), two (F) seven (G) independent experiments and are presented as arbitrary values over untreated cells. * indicates p < 0.05. DMSO 0.04% was also tested to exclude D4476 vehicle induced toxicity.
